
When Numbers Diverge:
A Tale of Two Trading Partners
Building Harvard Growth Lab's International Trade Datasets
By Sebastián Bustos, Ellie Jackson, David Torun, Brendan Leonard, Nil Tuzcu, Piotr Lukaszuk, Annie White, Ricardo Hausmann & Muhammed A. Yıldırım
Trade data powers decisions, from public policy to private investment. But the raw numbers often don't add up. When two countries trade, both report the same transaction, yet their figures often disagree. And over time, product classifications change, making it hard to compare trade data between countries. Here we explain how the Harvard Growth Lab builds a cleaner, more consistent trade dataset by: 1) Reconciling discrepancies between exporters and importers (mirroring); 2) Harmonizing product categories across classification changes using economically relevant weights. The end result is a publicly available trade dataset and a resource for researchers, policymakers, and anyone curious about how the world trades.
Read the Research Paper Reporting
 Country
 Reporting
 Country
$497M more
Country A and Country B are trading partners. In theory, their reported trade data should align. In practice, it rarely does.
This discrepancy highlights two persistent challenges in international trade data: (1) how countries report trade, and (2) how products are mapped across classification systems. This site explains both issues, and how the Growth Lab handles them.
1. The Reporting Problem
In 2024, both Country A and Country B submitted their bilateral trade statistics to UN Comtrade for the calendar year 2023. Despite their shared transactions, their reported trades with each other did not align.
For example, Country A reported that they exported $603 million to Country B.
Meanwhile, Country B reported that they imported $1.1 billion from Country A.
Both countries are reporting the same flow of goods. Yet Country A reported $497 million less than Country B.
If Country B reports imports 82% higher than Country A reports exports, what is the true value of trade transacted between the two countries?
Now, scale this example of Country A and Country B to all countries and their trading partners. The discrepancies compound.
Countries appear in the rows as exporters and in the columns as importers. Each square therefore represents trade between a specific exporter-importer pair. Countries are ordered by total trade volume, so the biggest traders appear toward the top-right of the chart. The diagonal is blank because it represents countries trading with themselves, which is excluded intentionally.
1.1 How Significant is the Reporting Problem?
Let's plot each country-country trading pair on a grid. In an ideal case, all countries report trade with all partners, and exporter and importer values align within a reasonable margin, say 25%. If this were true, every cell would be green, indicating complete reporting and aligned export and import values across all country pairs.
In reality, the grid is fragmented, reflecting uneven reporting across countries. Let's consider 2010 global trade data as a representative example.
22% of country pairs reported trade values that aligned, with a discrepancy of less than 25% between the exporter's and importer's values.
23% of country pairs both reported, but with major discrepancies. Each side recorded the same trade relationship, but their values differed by more than 25%.
In the remaining 55% of pairs, at least one country did not report any trade. 11% were reported only by importers...
...and 10% only by exporters. For the remaining 34% of country pairs, neither country reported trade data.
The resulting grid diverges sharply from the ideal. Much of global trade data is missing, unevenly reported, or inconsistent across countries.
Before global trade data can reliably inform policy or economic analysis, these gaps and inconsistencies must be addressed.
Whose trade value do we trust?
1.2 How Does the Growth Lab Address the Reporting Problem?
Trade is one of the few administrative datasets recorded twice: once by the exporter and once by the importer. Combining these two reports—often called mirroring—sounds straightforward, but in practice the numbers often don't match.
One solution might be to take a simple average but that would treat both sides as equally reliable, which is not the case. Instead, we need an approach that gives greater weight to the more trusted source.
Another approach might be to rely on external proxies of "quality", such as income level or governance scores. However, these measures tend to be incomplete over time and weak predictors of reporting accuracy.
Instead, the Growth Lab evaluates discrepancies across the entire network of trade relationships to infer how consistently each country reports trade, separately from reported trade volumes. A key constraint however is that countries cannot be penalized for discrepancies driven by unreliable partners. A large mismatch with an unreliable partner is less informative than a smaller mismatch with a consistently reliable one. For this reason, reporting reliability is inferred in a network-aware manner, using network metrics described in our published paper.
From here, we combine the two reports into a single best estimate using a reliability-weighted blend. More reliable reporters receive greater weight. The result is transparent, reproducible, and adaptive over time, providing a practical way to turn two messy numbers into one trusted measure of actual trade flow.
Returning to the Country A and Country B example, suppose Country A is generally more consistent in its reporting, with fewer discrepancies across reliable partners.
In that case, Country A's reported value receives greater weight when estimating the true trade flow between the two.
Applied to all country pairs, this method reconciles conflicting reports and produces a more accurate and unified view of global trade.
2. The Product Concordance Problem
With reporting discrepancies reconciled, another issue remains: trade products are not always labeled the same way over time. Each year, countries report using a single product classification vintage, but these systems are periodically updated and product codes are split, merged, or renamed. Without a way to map product codes across vintages, we can't make consistent comparisons across years, or align data when countries use different vintages in the same year. Our solution is a method to harmonize product classifications across time.
2.1 What is the Product Concordance Problem?
International trade data depends on product classification systems that assign codes to goods. These systems change over time as new products emerge and definitions are refined.
The World Customs Organization (WCO) maintains the Harmonized System (HS), the global standard for classifying traded products. Every five years, the WCO releases a new HS vintage that adds new products, clarifies existing definitions, and reflects evolving technologies and trade policies. Combined, these adjustments improve how trade is recorded over time.
For example, under the HS2007 vintage, apples had a code of 080810, electronic integrated circuits had a code of 854231, and umbrellas had a code of 660199.
To illustrate how product concordance works in practice, consider a specific example: how a single HS2007 product code maps back to earlier classification vintages. This example focuses on electronic integrated circuits (product code 854231 in HS2007).
With each new vintage, the WCO provides correspondence tables that map product codes between vintages. This diagram illustrates how a single HS2007 code—854231 (Electronic Integrated Circuits)—traces back through earlier classification systems. Moving backward in time, this one code corresponds to four codes in HS2002, which expand to six codes in HS1996, before consolidating into four distinct codes in HS1992: digital monolithic ICs, non-digital monolithic ICs, hybrid ICs, and other electrical parts.
However, there is one major issue—these tables only describe the code relationships. They do not specify how to allocate trade values when one code splits into several, or when multiple old codes merge into one.
Without allocation weights, UN Comtrade collapses all code relationships into simple one-to-one mappings. This creates three critical problems:
- Loss of structural detail: One-to-many and many-to-many relationships are forced into one-to-one relationships.
- Systemic data loss: When a single code maps to multiple targets, only one receives the trade value. The remaining valid codes are dropped entirely.
- Misrepresented trade values: Reported trade values no longer reflect how trade is actually distributed across products.
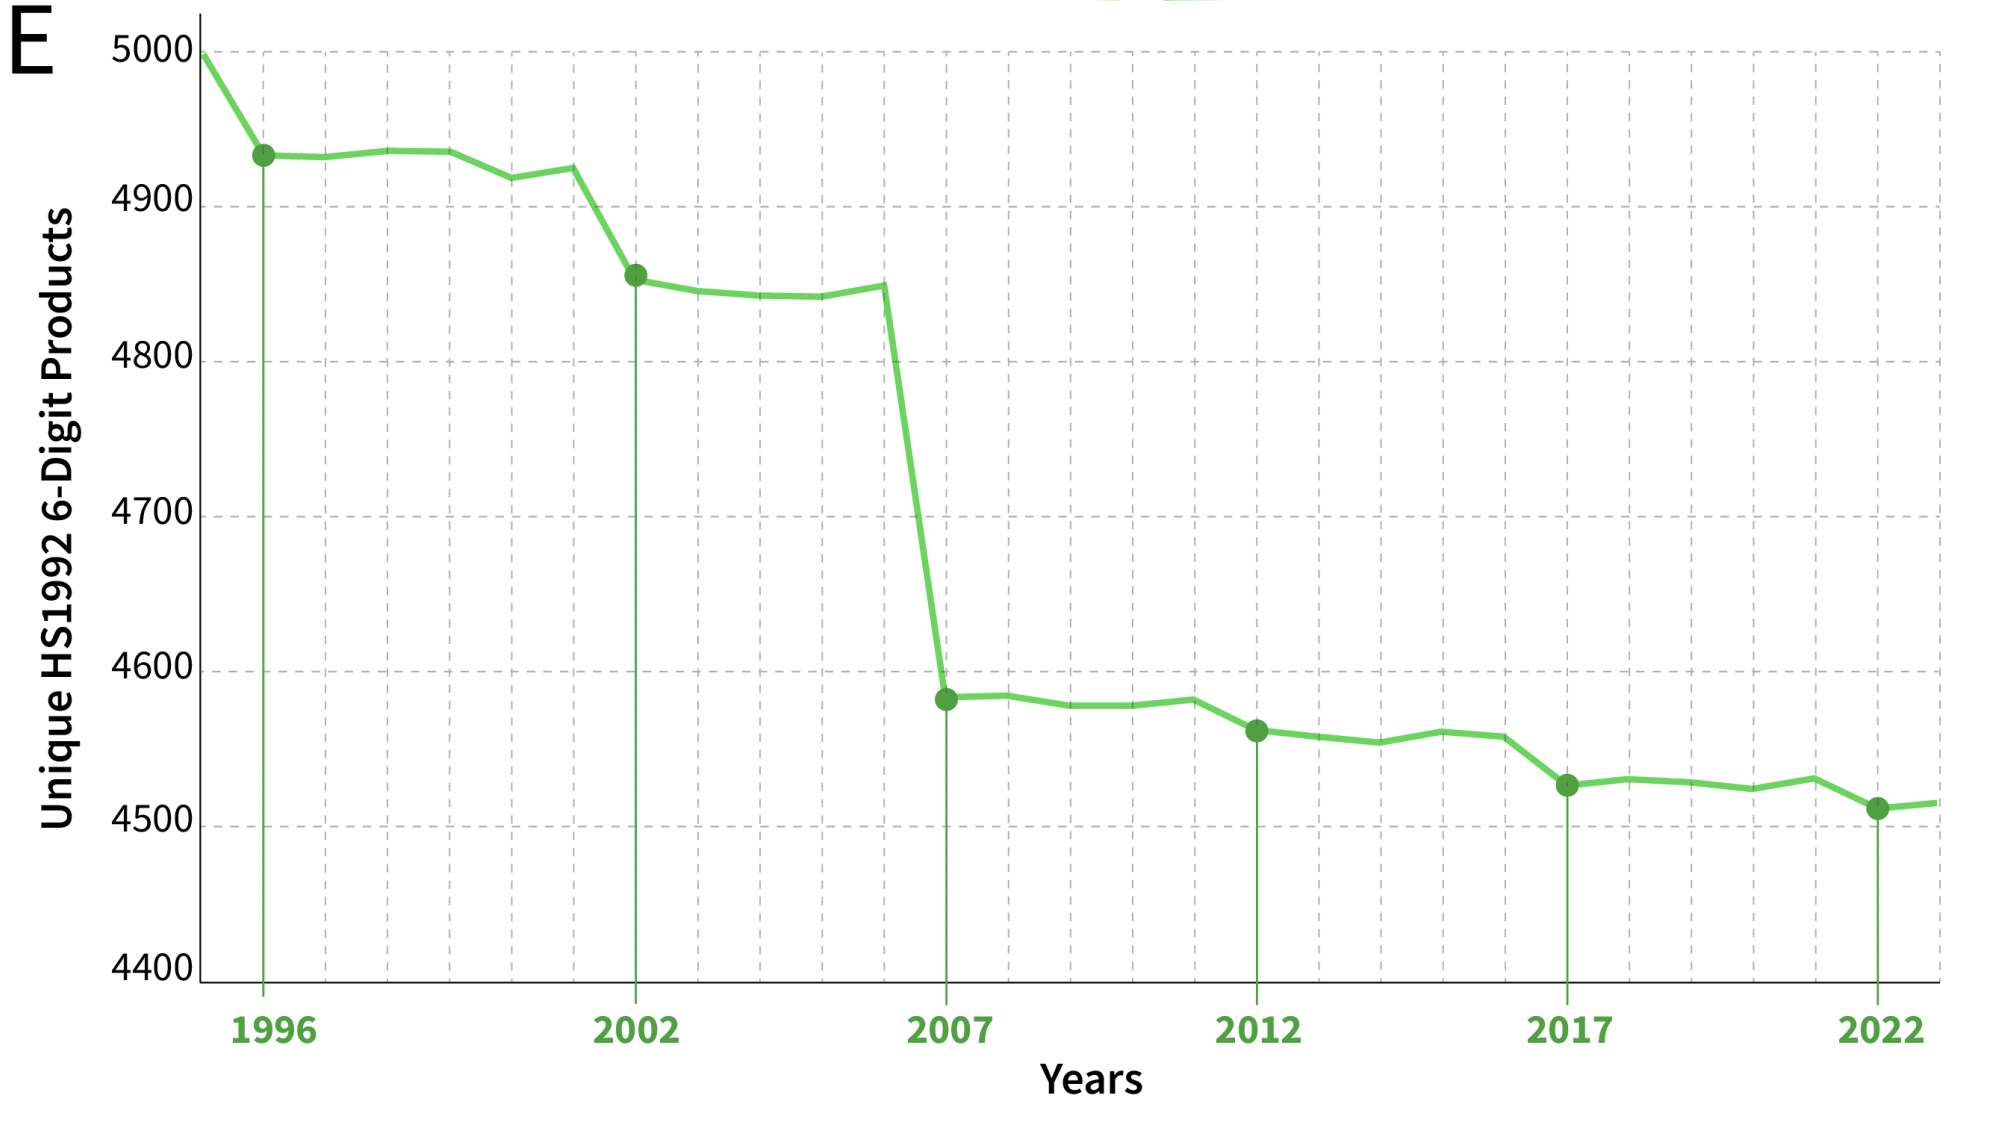
This problem compounds over time. Converting trade data from 1995 to 2024 using HS1992 requires chaining multiple correspondence tables across successive revisions (HS2022 → HS2017 → HS2012 → HS2007 → HS2002 → HS1996 → HS1992). At each conversion products are lost because one-to-one mappings cannot preserve one-to-many or many-to-many relationships. These losses accumulate with every conversion.
As a result, Comtrade's 2023 data converted back to HS1992 contains only around 4,500 six-digit codes, roughly 500 fewer than the 5,040 products defined in HS1992.
2.2 How Does the Growth Lab Address the Product Concordance Problem?
Our conversion method relies on a key insight: global trade patterns are relatively stable from year to year. As a result, the market composition of each product remains consistent in the years immediately before and after a new vintage is introduced.
This stability allows us to construct conversion weights using countries that transition from an older to a newer classification vintage. These countries provide a natural bridge between systems. By comparing their reported trade patterns before and after the transition, we infer how products map across classifications and derive weights for converting data between vintages.
Using conversion weights, Electronic Integrated Circuits data under HS2007 can be converted back to HS1992. The conversion proceeds sequentially across classification vintages, reallocating trade values from HS2007 to HS2002, then to HS1997, and finally to HS1992.
At each step, reported trade values are multiplied by the relevant conversion weights, ensuring that trade is systemically reclassified as it moves backwards through the Harmonized System.
Once converted to HS1992, the Electronic Integrated Circuits category reallocates into:
- 68% to code 854211 (digital integrated circuits)
- 23% to code 854219 (non-digital integrated circuits)
- 9% to code 854290 (other electronic integrated circuits)
- 0% to code 854800 (parts for integrated circuits)
Now these weights reflect actual trade flows and provide a probabilistic allocation that preserves the total trade value. Rather than choosing a single "best match," this approach distributes trade across multiple product codes in proportion to observed market patterns, resulting in more accurate historical comparisons.
3. The Impact of An Improved Trade Dataset
By addressing these two structural limitations of global trade data, the Growth Lab is able to apply these methods directly in its own tools and research.
Trade data is first harmonized across vintages using our economically balanced weights. Validating against the International Monetary Fund's Balance of Payments data confirms that this approach accurately reconstructs trade patterns, even for non-reporting countries.
Together, these methods recovered $861 billion in trade in 2024 alone and recovered 8 percent of product codes.
Applied across all country pairs and six decades of trade data, this methodology underpins the Atlas of Economic Complexity, the Growth Lab's flagship data tool. Since 2013, the Atlas has supported decision-making by trade ministries, central banks, multinational firms, development agencies and academic researchers. The Atlas of Economic Complexity translates this data into accessible visualizations, while the underlying datasets enable rigorous empirical analysis.
Explore The Data
All components of the Growth Lab's trade data methodology are openly available. You can reproduce the full workflow or adapt individual steps to build your own bilateral trade datasets for any classification vintage and time period.
Code & Tools
Support
For methodological questions, data access, or research use cases, contact growthlabtools@hks.harvard.edu.
Recommended Citation
Please cite the paper, datasets, and code when using these resources.
Paper:
Bustos, S., Jackson, E., Torun, D., Leonard, B., Tuzcu, N., Lukaszuk, P., White, A., Hausmann, R., Yildirim, M.A. (2025). "Tackling Discrepancies in Trade Data: The Harvard Growth Lab International Trade Datasets." Scientific Data 13, 170 (2026). https://doi.org/10.1038/s41597-025-06488-2
Datasets:
Harvard Growth Lab. "Bilateral Trade Data Aggregated by Year," 2025. https://doi.org/10.7910/DVN/5NGVOB.
Harvard Growth Lab. "Weighted Classification Conversion Tables," 2025. https://doi.org/10.7910/DVN/6AADMR.
Code:
Harvard Growth Lab. Comtrade Downloader (2025). https://github.com/harvard-growth-lab/comtrade-downloader.
Harvard Growth Lab. Comtrade Conversion Weights Generator (2025). https://github.com/harvard-growth-lab/comtrade-conversion-weights.
Harvard Growth Lab. Comtrade Mirroring Pipeline (2025). https://github.com/harvard-growth-lab/comtrade-mirroring.